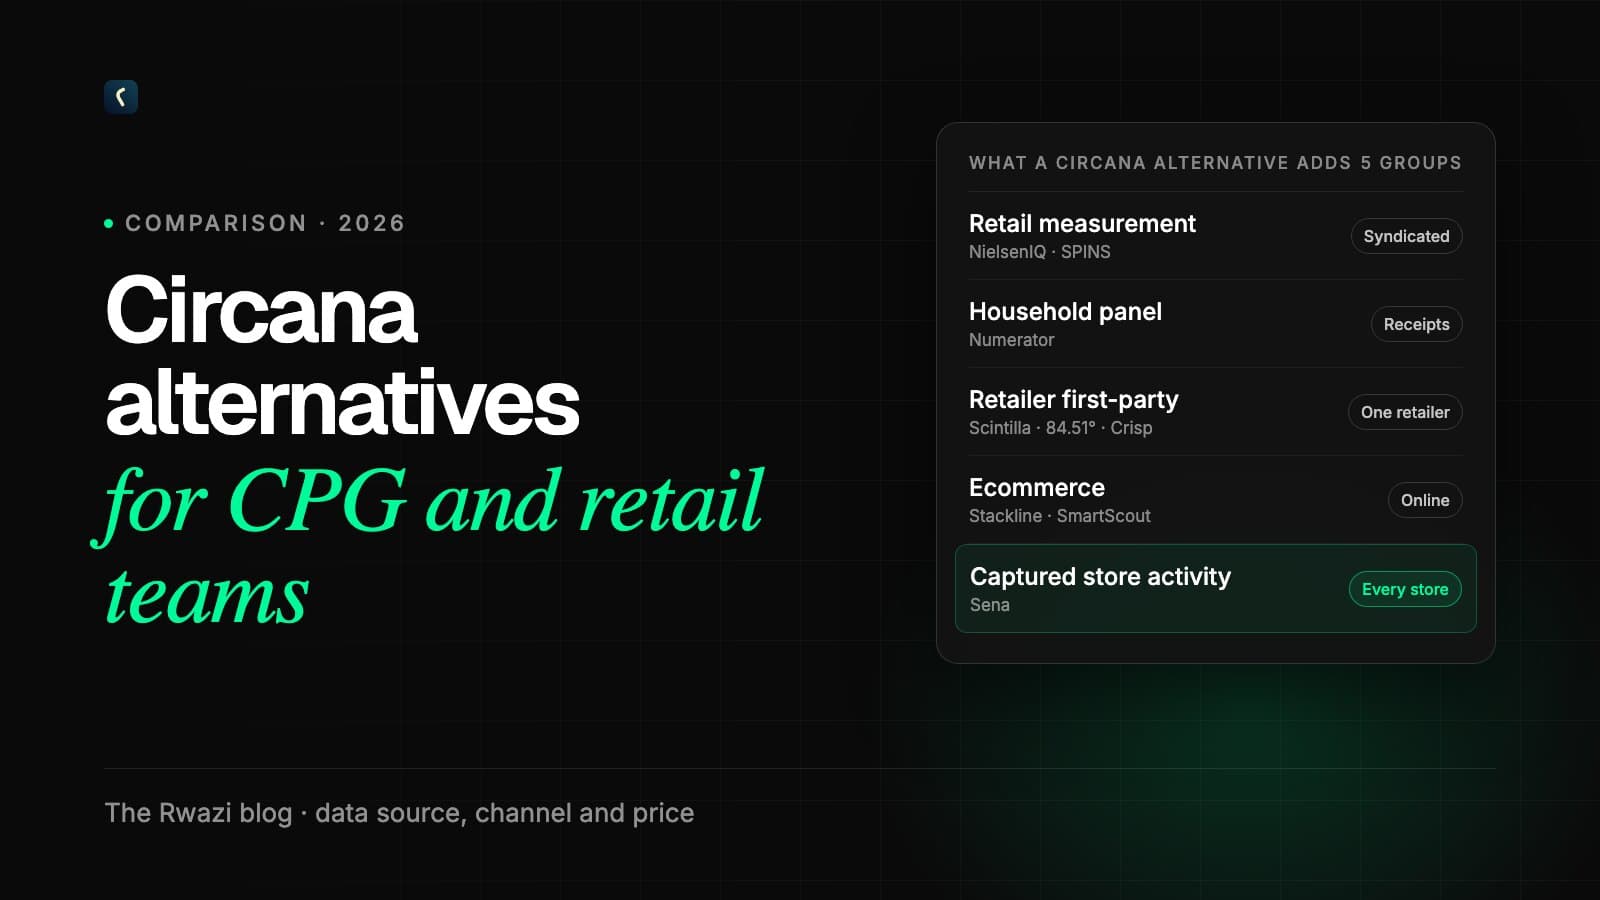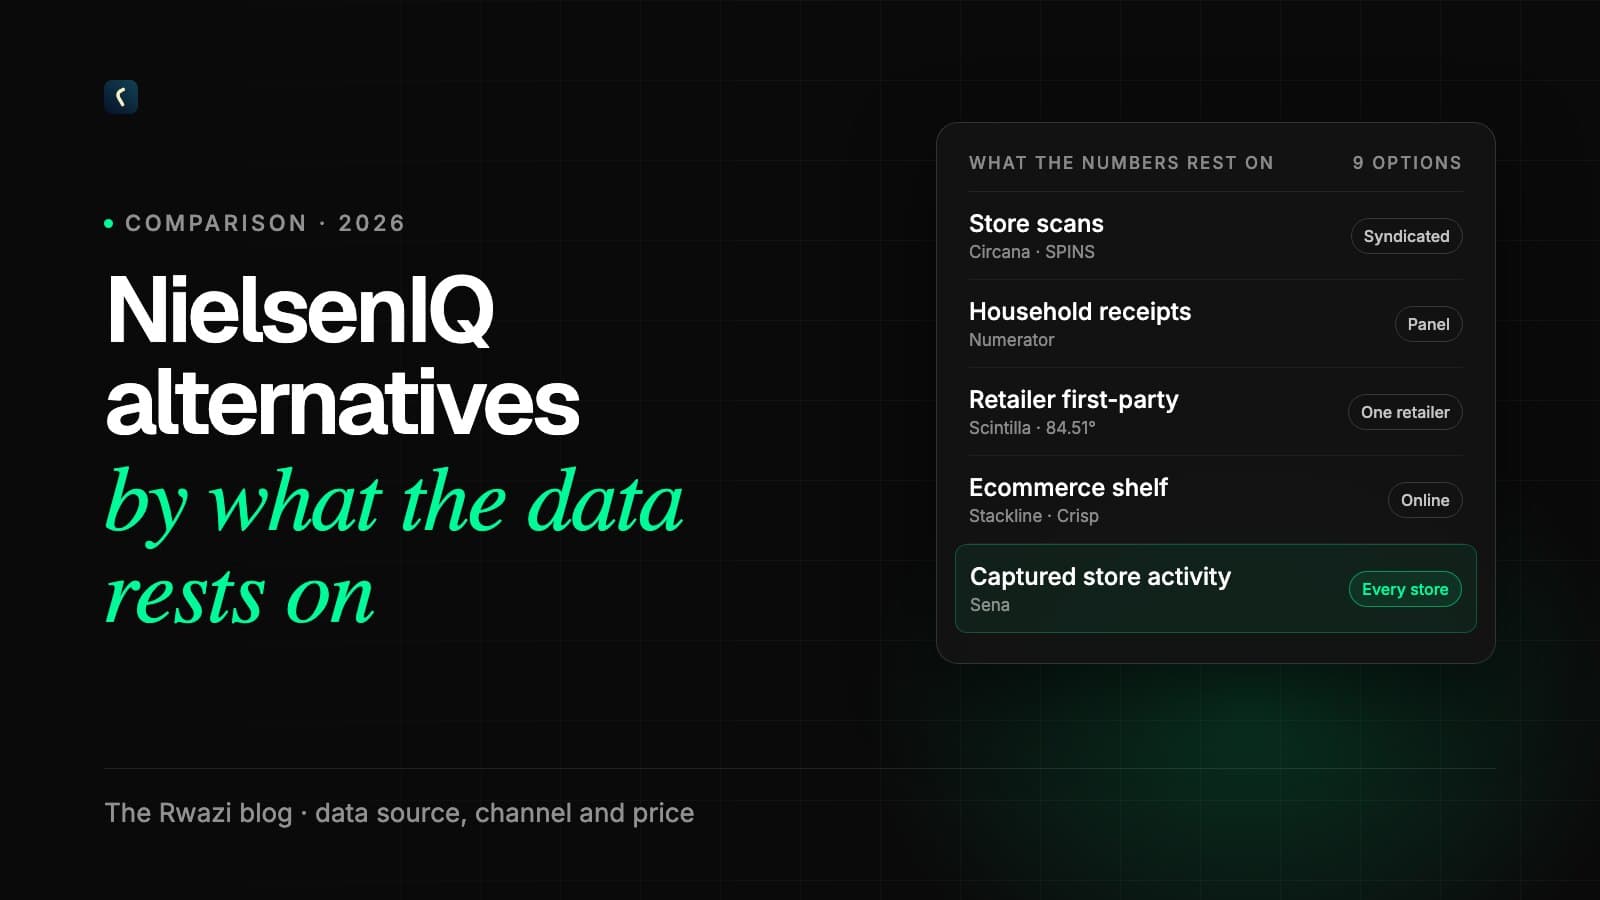
The main NielsenIQ alternatives are Circana, SPINS, Numerator, retailer data programs such as Scintilla (Walmart) and 84.51° (Kroger), Stackline for Amazon, and Crisp for retailer portal data. Each one measures a different slice of the market. Many enterprise teams keep NielsenIQ and add the source that covers the stores, channels, and markets its scan reaches least.
The question usually comes up at renewal or when a share moves in the file, and the team's own shipment data tells a different story before a retailer review.
How we compared these options.
Each option is sorted by what its numbers rest on (store scans, receipts, retailer first-party data, e-commerce data, or captured activity), then matched to a category, a sales channel, and a budget.
Prices appear only where the company or a named third party publishes them, with the date we read them. Every source is named and linked where it is public.
Key takeaways
- Sort by the data underneath: Store scan data, household receipts, retailer first-party data, and captured store activity each answer a different question.
- Keep and add is the common move: Syndicated contracts run for years, and retailer reviews are built on them. Many CPG teams also use multiple data sources for a more complete market view (Bedrock Analytics, April 2026).
- Channels decide the addition: Walmart, Kroger, and Amazon each run their own data programs. Natural and specialty stores sit with SPINS. Club stores sell data through retailer portals.
- Check what an option can read: The addition worth a budget line reads the NielsenIQ exports a team already licensed next to its own shipment data, so retailer reviews keep one shared reference.
NielsenIQ in one box
| Field | NielsenIQ (NIQ) |
|---|---|
| What it measures | What consumers buy in stores and online, for consumer goods, tech, and durable makers and retailers |
| Core products | Retail measurement from store scan data; the Homescan household panel; BASES for concept and volume forecasting; Byzzer for smaller brands; NIQ Digital Shelf (formerly Data Impact) for digital shelf analytics |
| Split from Nielsen | 2021, when Nielsen sold its Global Connect business, now NIQ, to Advent International. Nielsen kept TV and audience measurement. |
| GfK | NIQ and GfK completed their combination on July 11, 2023, reporting over $4 billion in combined sales and 30,000+ clients (NIQ). GfK is part of NIQ today. |
| Ownership | Listed on the New York Stock Exchange since July 2025 and majority owned by Advent International (Simpson Thacher, Jul 24 2025) |
Nielsen and NielsenIQ are two separate companies. A search for "Nielsen competitors" or "Nielsen alternatives" often returns TV ratings companies, which compete with Nielsen. This guide covers NielsenIQ competitors in retail measurement, with a focus on consumer goods.
What a NielsenIQ alternative replaces?
A team replaces one NielsenIQ job at a time.
| NIQ product | The job it does | Alternatives for the same job |
|---|---|---|
| Retail measurement | Sales, share, price, and store coverage from scanned retailer data | Circana; SPINS for natural and specialty; Scintilla and 84.51° Stratum for single-retailer depth |
| Homescan | Which households buy what and where? | Numerator; the Circana household panel |
| BASES | Concept tests and launch volume forecasts | Zappi, Kantar Marketplace, Ipsos |
| Byzzer | Self-serve category reports for smaller brands | SPINS Ignite+; Circana Liquid Data Go; Crisp |
| NIQ Digital Shelf (formerly Data Impact) | Digital shelf analytics for ecommerce | Salsify PXM, Syndigo, C5i Compete, Stackline |
For NIQ Digital Shelf (formerly Data Impact), top alternatives on Gartner Peer Insights include Salsify PXM, Syndigo Digital Shelf Analytics, and C5i Compete (Gartner Peer Insights).
NielsenIQ alternatives grouped by what their data rests on
| # | Option | What its data rests on | Best for | Pricing model | Published price | Watch for |
|---|---|---|---|---|---|---|
| 1 | Circana | Scanned retail sales plus a household panel | Mainstream grocery, drug, and mass | Annual subscription; Liquid Data Go for small brands | Liquid Data Go: $499 per story of 5 reports (Circana, Oct 20 2026); full plans quoted | Retailers that keep scans private |
| 2 | SPINS | Natural, organic, and specialty store data | Natural and wellness brands | Annual subscription; Ignite programs | Ignite+ plans from $250 a month (SPINS, archived Jul 10 2026); current page quote only | Narrower mainstream grocery view |
| 3 | Numerator | Receipts from a consumer panel | Shopper trips across many retailers | Subscription | Quote only (4analytics) | Receipts show the purchase; shelf price and stock need a separate capture |
| 4 | Scintilla (formerly Walmart Luminate) | Walmart's first-party sales and shopper data | Walmart-heavy suppliers | Basic with Walmart supplier access; Charter by subscription | Charter quote only (8th & Walton) | Walmart stores alone |
| 5 | 84.51° Stratum | Kroger's in-store and online transaction data | Kroger-heavy suppliers | Supplier access, quoted | Quote only | Kroger stores alone |
| 6 | dunnhumby | Shopper data from its retail partners | Suppliers selling through those retailers | Quoted | Quote only (4analytics) | Partner retailers alone |
| 7 | Stackline | Ecommerce marketplace data, led by Amazon | Amazon-heavy brands | Subscription | Quote only | Depth sits in ecommerce marketplaces |
| 8 | Crisp | Retailer portal data joined across many retailers | Smaller brands with portal access | Subscription | Quote only | Depends on the portals a brand holds |
| 9 | Sena (Rwazi) | A team's uploaded files, including NIQ exports; business systems through 250+ integrations; consumer activity from a 5M+ network across 190+ countries, captured when a question needs it; computer vision on shelf and store images | Teams that keep NIQ and add the stores and markets its scan reaches least | Quoted after a demo | Quote via demo | An added layer next to a syndicated file |
A. Retail measurement and tracking alternatives
1. Circana
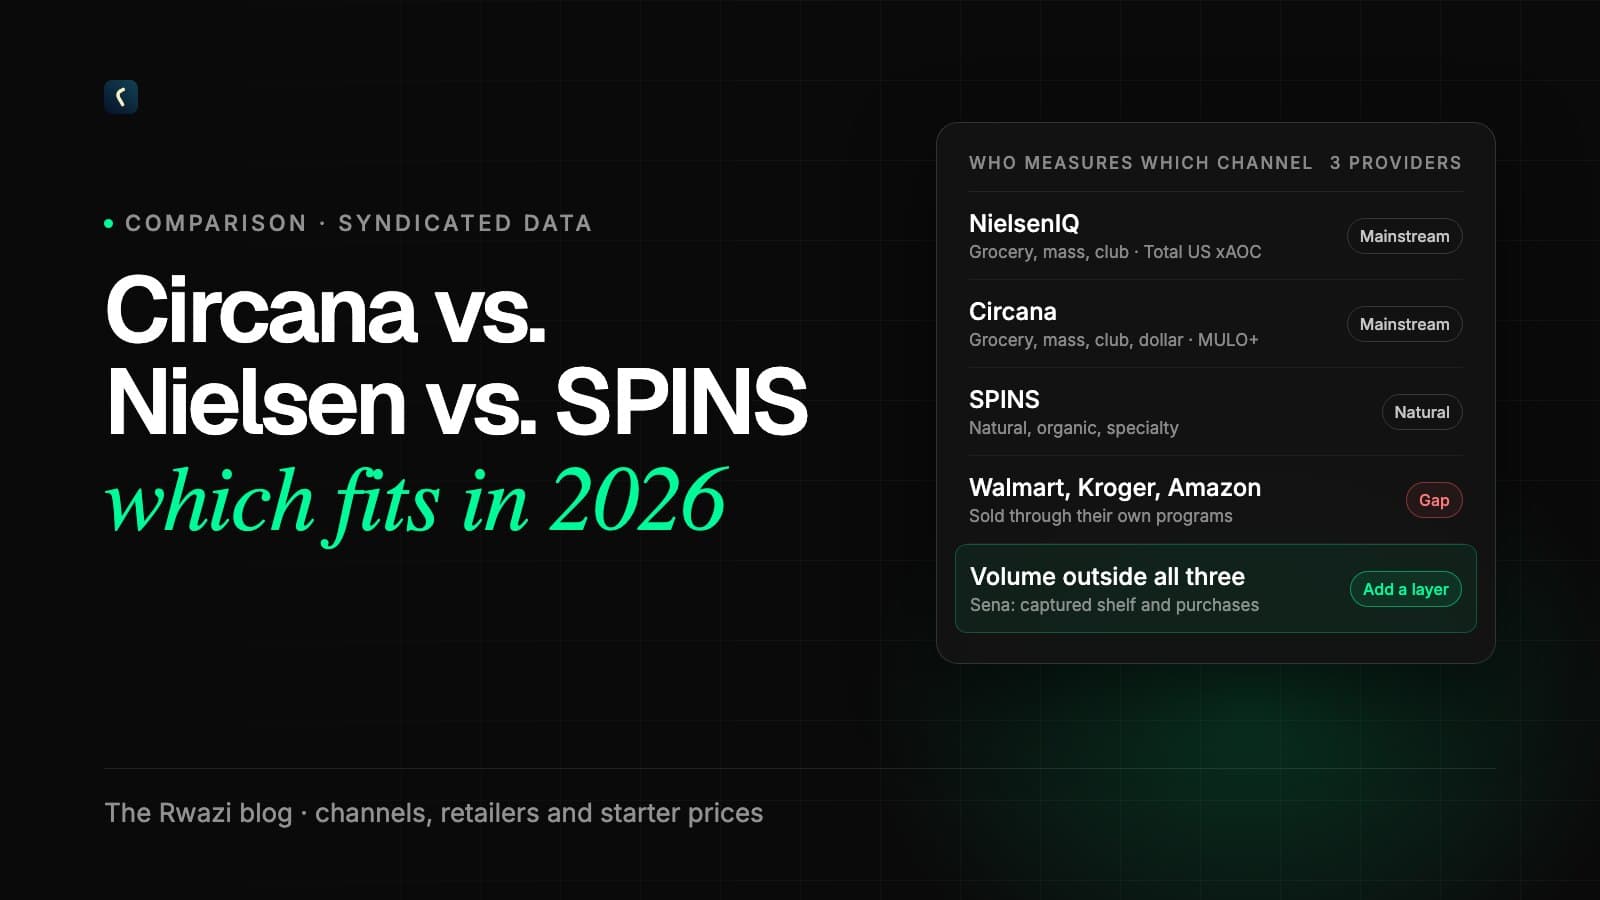
Circana formed when IRI and NPD merged, a deal that closed in August 2022 (Circana). It sells scanned retail sales across grocery, drug, and mass, plus a household panel. Its MULO dataset aggregates sales across grocery, mass, club, dollar, and select retail channels, and MULO+ adds channels such as ecommerce and convenience (Bedrock Analytics, April 2026).
Best for: a second market-wide view, or teams whose key retailers share data with Circana.
Watch for: its retailer coverage overlaps NIQ's but differs, so check which key accounts each one covers (for example, Kroger is exclusive to Circana).
2. SPINS
SPINS focuses on natural, organic, and specialty retail. Its Natural Enhanced Channel covers natural, specialty, and gourmet stores (Bedrock Analytics, April 2026). On its own site, SPINS lists point-of-sale data from 1,900+ natural stores exclusive to SPINS and a conventional channel of 110,000+ stores powered by Circana, and it tags every product by thousands of attributes (SPINS, read Oct 20 2026). Best for: wellness, organic, and health-led brands. Watch for: Scout reports that Whole Foods sits outside the SPINS scanner stream (Scout), so confirm Whole Foods coverage before buying.
B. Household panel alternatives
1. Numerator
Numerator builds its panels from shopper receipts. It publishes 200K households in the Total Commerce Panel behind Numerator Insights and 1M+ active households in the Measurement Panel behind TruView (Numerator). Kantar announced in January 2025 that Worldpanel would merge into Numerator (Daily Research News).
Since July 1, 2025, Numerator's global business has traded as Worldpanel by Numerator (Kantar).
Best for: who buys, how often, and across which retailers.
Watch for: a receipt records the moment of payment; shelf price, stock, and placement need a separate capture.
C. Retailer first-party data alternatives
1. Scintilla (formerly Walmart Luminate)
Walmart announced in October 2024 that its insights ecosystem, Walmart Luminate, would become Scintilla (Walmart). It runs on Walmart first-party transaction data, with hourly or daily trends, store and e-commerce breakouts, pre-purchase search behavior on Walmart.com and the Walmart app, and surveys of verified Walmart shoppers (Walmart Data Ventures, read Oct 20 2026).
Best for: suppliers with a large share of sales at Walmart.
Watch for: it covers Walmart alone, so multi-retailer brands join it with other feeds.
2. 84.51° Stratum
84.51° is Kroger's retail data science company, and Stratum is its supplier data product built on Kroger's in-store and online transactions (Supermarket News, Jul 2019). 84.51° says its data covers more than 62 million US households (84.51°, read Oct 20 2026). Stratum, sold through Kroger Precision Marketing, shows the previous week's retail data plus daily point-of-sale, inventory, and supply chain updates, down to UPC level by geography and modality (Kroger Precision Marketing, read Oct 20 2026).
Best for: Kroger-heavy suppliers that want shopper-level detail.
Watch for: Kroger stores alone.
3. Dunnhumby
dunnhumby builds shopper data products from the loyalty data of its retail partners, and 4analytics lists it next to Circana and Numerator as a NielsenIQ alternative (4analytics). It gives brands the customer data and category frameworks their retail partners use through supplier collaboration programs built on retailer-trusted customer insights, and its homepage features Tesco as a client (dunnhumby, read Oct 20 2026).
Best for: suppliers with volume at dunnhumby's partner retailers.
Watch for: coverage follows those partners, so ask dunnhumby for its partner roster in each market.
4. Crisp
Crisp joins retailer portal data across many retailers into one feed. It ingests point-of-sale, inventory, planogram, and shipment data from hundreds of retailer and distributor connections in the US and abroad, delivers DC, SKU, and store-level data, and connects to Databricks, Snowflake, and Google Cloud (Crisp, read Oct 20 2026).
Best for: smaller brands that already receive portal data from their retailers.
Watch for: the view depends on which portals a brand can access.
D. Digital shelf and ecommerce analytics alternatives
1. Stackline
Stackline covers ecommerce marketplaces, led by Amazon, with sales, share, and search data. Its Atlas product reports market share across Amazon, Walmart, and other ecommerce retailers for more than one billion products, updated weekly, and Stackline says more than 7,000 consumer brands use it (Stackline, read Oct 20 2026).
Best for: brands with heavy Amazon volume.
Watch for: its depth sits in ecommerce marketplaces, so confirm which in-store data a plan covers.
2. Salsify and Syndigo
Salsify and Syndigo manage product content and track how products appear across retail websites. They compete with NIQ Digital Shelf (formerly Data Impact), NIQ's digital shelf product, more than with NIQ retail measurement. Salsify publishes about 750 million products to 2,600 commerce destinations for more than 2,000 customers, and Cinven agreed to acquire it in July 2026, subject to approvals (Salsify, read Oct 20 2026).
Syndigo, which now includes 1WorldSync, connects 15,000 brands and 3,500 retailers and tracks competitor pricing, assortment, and availability (Syndigo, read Oct 20 2026).
Best for: ecommerce teams fixing listings, content, and search visibility.
Watch for: they track the online shelf; store sales come from retail measurement.
E. Global market sizing alternatives
1. Euromonitor, Mintel, and Kantar
Euromonitor and Mintel, both market intelligence platforms, sell top-down market sizes, forecasts, and trend reports across countries. Kantar sells brand tracking and creative testing. They answer how big a market is and how people see a brand, which complements NIQ's view of what sold.
Euromonitor and Mintel also sell single reports: Euromonitor lists "Snacks in the US" at USD 2,450 (Euromonitor, read Oct 20 2026), and Mintel lists its "US Pet Food Market Report 2026" at $4,995 (Mintel, read Oct 20 2026).
GfK now sits inside NIQ after the 2023 combination, so it counts as part of NIQ in this comparison.
The stores and channels NielsenIQ misses, and which alternatives cover them
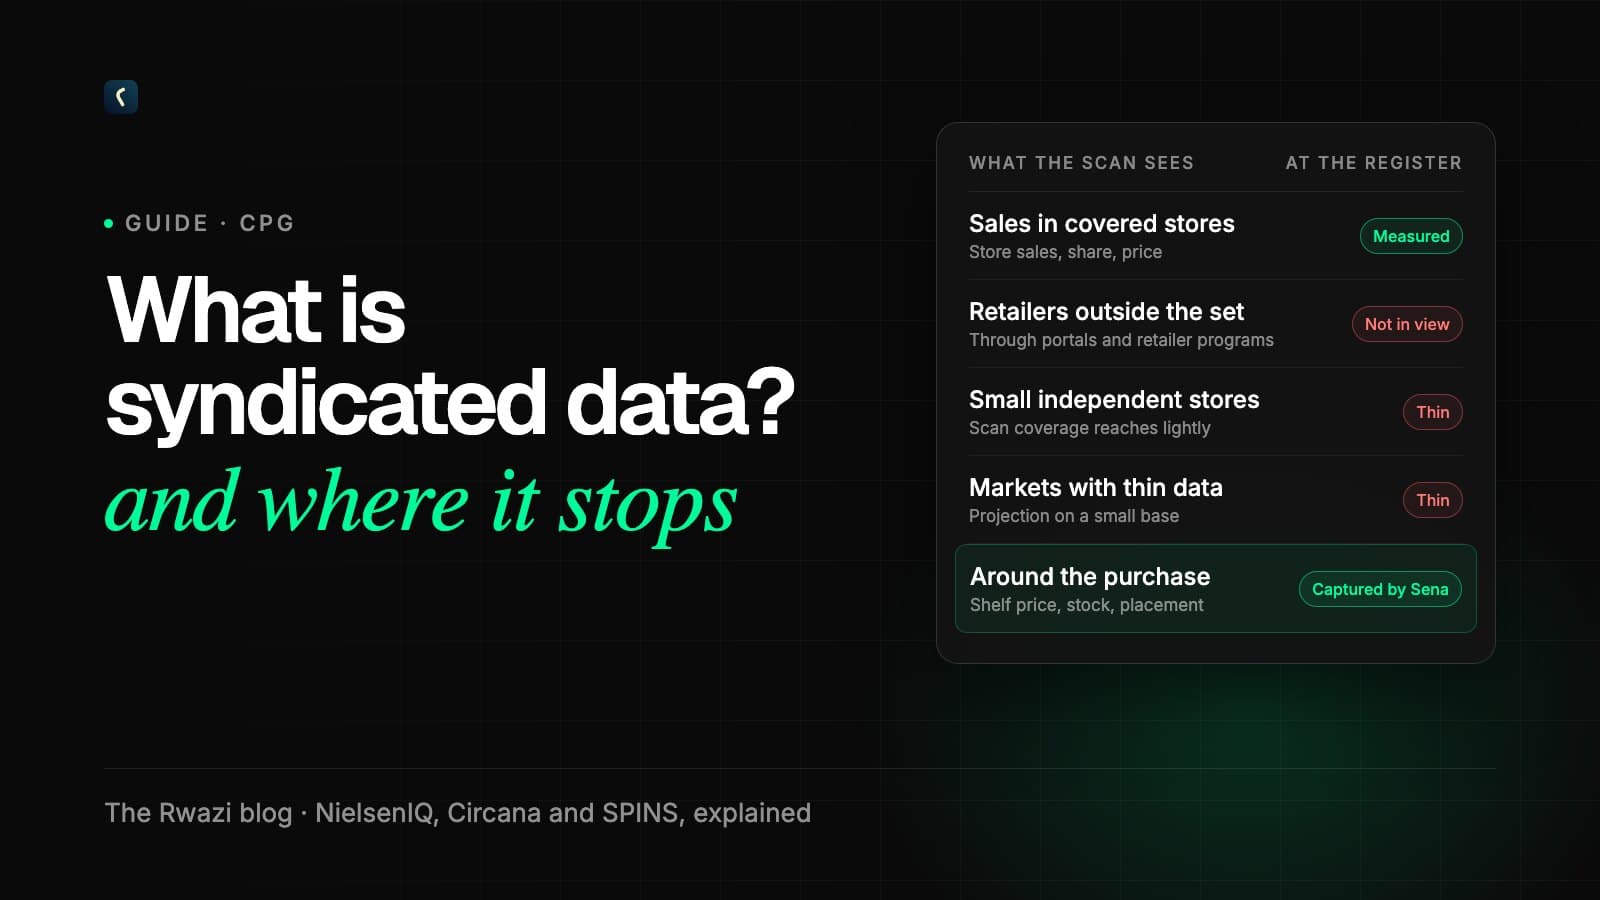
Every syndicator leaves coverage gaps, because each provider has exclusive retailer ties (Bedrock Analytics, April 2026). Some retailers sell data through their own portals: Bedrock's August 2024 guide lists Costco among more than 30 retail portals outside standard syndicated packages (Bedrock Analytics, Aug 2024).
| Where the sale happens | Where the data comes from |
|---|---|
| Walmart | Scintilla (formerly Walmart Luminate) |
| Kroger | 84.51° Stratum |
| Costco and other club stores | Retailer portals, joined through Crisp or a data team |
| Amazon and other marketplaces | Stackline |
| Natural, organic, and specialty stores | SPINS |
| Small independent stores and markets with thin published data | Consumer activity captured when a question needs it, such as shelf images and purchase records |
NielsenIQ vs. Circana vs. SPINS for CPG retail measurement
| NielsenIQ | Circana | SPINS | |
|---|---|---|---|
| Core channels | Grocery, mass, club, drug, and select ecommerce | Grocery, mass, club, dollar, and select retail; MULO+ adds ecommerce and convenience | Natural, organic, and specialty |
| Signature dataset | Total US xAOC (All Outlet Combined) | MULO and MULO+ | Natural Enhanced Channel |
| Whole Foods | Receives Whole Foods point-of-sale data, per Scout, citing a 2016 announcement | Projects Whole Foods into channel totals, per Scout | Outside the scanner stream, per Scout |
| Household panel | Homescan | Household receipt panel | TriLens shopper panel; core strength is retail scan data |
| Starter tier | Byzzer from $1K, $4,950, and $10K packages | Liquid Data Go, $499 per story of 5 reports | A free SPINS account unlocks monthly category insights (Free Category Insights); Ignite+ plans from $250 a month as of July 2026 |
Sources: channels and datasets from Bedrock Analytics, April 2026; Whole Foods from Scout, which notes the 2016 arrangement is the last public word, so confirm it with each provider; prices from NIQ and Circana, read Oct 20 2026, and from SPINS's Ignite+ page, archived Jul 10 2026.
What NielsenIQ alternatives cost: published prices vs. quote-only
| Option | Published price | Source and date |
|---|---|---|
| NIQ Byzzer | From $1K; $4,950 for 20 report runs, 5 markets, and 6 categories; $10K with 5 team seats and 5 categories. Startup CPG members, first purchase | nielseniq.com, Oct 20 2026 |
| Circana Liquid Data Go | $499 per story of 5 reports | circana.com, Oct 20 2026 |
| SPINS Ignite+ | Plans from $250 a month in July 2026; current page quote only | SPINS, archived Jul 10 2026; spins.com, Oct 20 2026 |
| Circana, Numerator, dunnhumby full plans | Quote only | 4analytics |
| Euromonitor and Mintel single reports | "Snacks in the US" at USD 2,450; "US Pet Food Market Report 2026" at $4,995 | Euromonitor and Mintel, Oct 20 2026 |
| Scintilla Charter, 84.51° Stratum, Stackline, Crisp | Quote only; Scintilla Basic comes with Walmart supplier access. | Company sites; 8th & Walton |
Which NielsenIQ alternative fits by category, sales channel, and budget?
- By contract decision: Keep NielsenIQ when it measures the retailers that carry most of the volume. Add a source for each channel, retailer, or market the file reaches lightly. Replace it when a second provider measures the key retailers better. For a side-by-side view, see Rwazi vs NielsenIQ.
- By category: Natural and organic categories lean on SPINS. Mainstream grocery and household categories lean on Circana or NIQ. Categories where shoppers spread purchases across many retailers lean on Numerator receipts.
- By sales channel: Walmart-heavy suppliers add Scintilla. Kroger-heavy suppliers add 84.51°. Amazon-heavy brands add Stackline. Brands selling through small independent stores or markets with thin published data add captured consumer activity.
- By budget: Enterprise teams keep NIQ and add one layer that covers the gaps. Mid-size teams run one full syndicated subscription. Smaller brands start with a starter tier: Byzzer from $1K or Liquid Data Go at $499 per story.
See which stores to fix before the next retailer review
A category team sees share fall in one region ahead of the next retailer review. Sena reads the team's NielsenIQ export, its own shipment data, and shelf activity captured in that region's stores, and returns priority actions: which stores ran out of stock and where a competitor dropped price.
The team decides which accounts to raise first. The NIQ contract stays. Book a demo to see Sena read a NielsenIQ export next to captured store activity.
Frequently asked questions
Who are NielsenIQ's main competitors?
Circana is NielsenIQ's closest competitor, selling scanned retail sales and a household panel across the same categories. SPINS competes in natural, organic, and specialty stores. Numerator competes on household purchase data built from receipts. Retailer programs such as Scintilla (Walmart) and 84.51° (Kroger) compete for the same budget with first-party data from their own stores.
Who are Nielsen's main competitors?
Nielsen, the TV and audience measurement company, competes with audience measurement firms such as Comscore, iSpot.tv, VideoAmp, and Fifty5Blue, formerly Kantar Media. NielsenIQ, the separate retail measurement company, competes with Circana, SPINS, Numerator, and retailer data programs.
What's the difference between Nielsen and NielsenIQ?
Nielsen and NielsenIQ are separate companies. Nielsen sold its Global Connect business to Advent International in 2021, and that business became NielsenIQ, which measures retail sales and shoppers across consumer goods, tech, and durables. Nielsen kept TV and audience measurement. NielsenIQ has traded on the New York Stock Exchange since July 2025, with Advent as majority owner.
Is NielsenIQ reputable?
Yes. NielsenIQ reported over $4 billion in combined sales and 30,000+ clients after combining with GfK in 2023, and it has been listed on the New York Stock Exchange since July 2025. Retailers and suppliers use its numbers as a shared reference in joint business planning and retailer reviews.
What type of company is NielsenIQ?
NielsenIQ is a retail measurement company that tracks what consumers buy in stores and online, across consumer goods, tech, and durables. Its products include retail measurement from store scans, the Homescan household panel, BASES concept forecasts, and Byzzer for smaller brands. It split from Nielsen in 2021 and has traded on the New York Stock Exchange since July 2025.
What happens when an added source disagrees with NielsenIQ?
Keep NielsenIQ as the shared reference for retailer reviews and use the added source to explain the gap. A difference between the two often points to stores, channels, or markets the scan reaches lightly, such as club stores, marketplaces, or small independent stores. Read both side by side and settle the number before the review.
Which alternatives cover stores outside NielsenIQ's scan?
Retailer programs cover their own stores: Scintilla for Walmart and 84.51° for Kroger. Stackline covers Amazon. Club stores such as Costco sell data through retailer portals. Small independent stores and markets with thin published data call for captured consumer activity, such as shelf images and purchase records captured when a question needs them.
Can NielsenIQ data be used inside an AI system?
Yes, within the terms of the NIQ license. A team can load the NielsenIQ exports it already licenses into a Decision AI such as Sena, which reads them next to internal sales data and captured consumer activity. Check the license for where licensed data may be stored and who may see it before loading it.
Should a brand keep NielsenIQ or replace it?
Most enterprise brands should keep NielsenIQ because retailer reviews and internal reporting run on it and add the source that covers their gaps. A full replacement suits brands whose volume sits in channels NIQ covers lightly, such as natural stores or Amazon. Small brands often start with a starter tier and grow into a full subscription.